
How It Works
My Training Building My
Cognitive Profile Training With My
Coach Maintaining
My Training
I Want To Discover HAPPYneuron 7 Days For Free
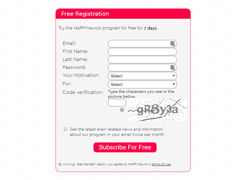
Try HAPPYneuron for 7 days and discover the complete program for free.
When registering you are asked to enter personal information such as your age. This type of information is necessary to build your profile and calculate your performance. It is also required to assess your progress in relation to your peers and accurately analyze your game results and chart your progress.
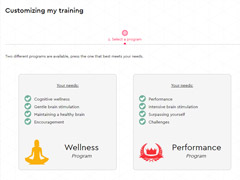
Personalizing My Program
To enjoy your free trial and start your training you can first personalize it. You can choose a program, a coach and define your email workout settings.

My Warm-Up
Step 1 - Building my cognitive profile
The coach needs to know your initial performance to give you the most appropriate exercises. In order to do so, you need to do a few exercises on your own, which will initialize your profile.

The Training
Step 2 - Starting the training
Being challenged regularly can be important for your brain health, just as physical exercise, good nutrition, and social interactions.

Maintaining the training
Step 3 – I regularly stimulate my brain
Regular training is the key to success if you want to keep your brain challenged. However, over time we tend to be forget and neglect routine activities. HAPPYneuron therefore offers you constant challenges, workout reminders, and regular new features to boost your motivation.


